Financing and Investment Environment
Economics of Next-Generation Geothermal Energy
SHARE


How EGS, Closed-Loop Systems, and Supercritical Geothermal Can Deliver 24/7 Carbon-Free Energy
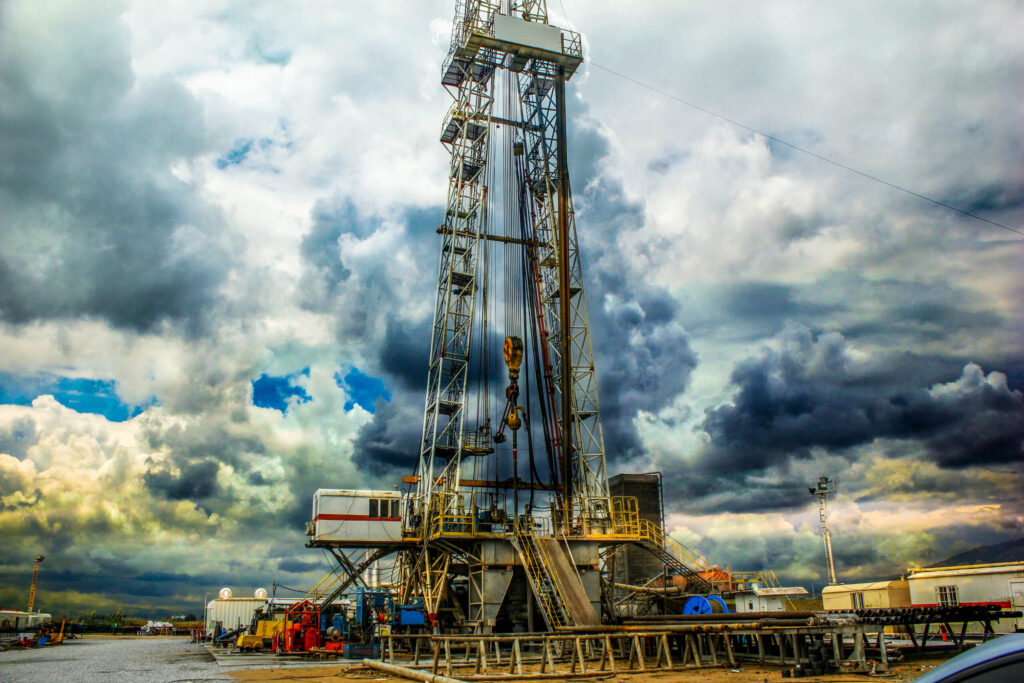
Geothermal power is shifting from resource exploration—finding naturally occurring hydrothermal reservoirs—to energy infrastructure in which subsurface heat-exchange systems are deliberately engineered and built. Enhanced geothermal systems (EGS), closed-loop systems that do not rely on induced fractures, and supercritical or superhot-rock geothermal targeting temperatures above 375°C could greatly expand both the geographic reach of development and the output of each well.
These technologies, however, should not be treated as mature renewables on a par with conventional geothermal. Proven technologies can be used for surface turbines and power cycles, but deep horizontal drilling, engineered reservoirs, extended sealed wellbores, ultra-high-temperature materials, and real-time subsurface monitoring remain at an early stage of commercialization. If technology readiness is assessed as a single aggregate, first-of-a-kind risk is concentrated in developers’ pricing and cost of capital, impeding project formation.
This article evaluates next-generation geothermal across three dimensions. First, how net output per well, capacity factor, and operating life affect LCOE. Second, how subsurface risk can be allocated through contracts and finance to lower WACC. Third, how geothermal compares with other generation sources when assessed through value-adjusted LCOE (VALCOE) and total system cost, including capacity, time-of-delivery energy, and flexibility value. The central issue is not absolute CAPEX, but maximizing lifetime generation and grid value from the same well field.
Solar and wind lead on plant-level cost for new generation but cannot choose when they produce. Nuclear offers stable low-carbon power but faces challenges in public acceptance and long construction schedules. LNG-fired generation is flexible but exposed to fuel imports, price volatility, and carbon constraints. Geothermal could occupy the middle ground as clean firm power: fuel-free, highly utilized year-round, and expandable in relatively small increments.
Contents
Beyond CAPEX Reduction: How Output Density Reshapes Project Economics
Next-generation geothermal is capital-intensive and front-loaded, with drilling and completion accounting for a large share of cost. Yet investment decisions should be based not simply on CAPEX divided by installed capacity, but on total lifecycle cost divided by lifetime electricity sales. Even if drilling costs remain high, greater net output per well, higher capacity factors, and longer operating lives allow fixed costs to be recovered across more generation. Conversely, even an inexpensive well is uneconomic if flow is inadequate, circulation power is excessive, or thermal decline is rapid.
The decisive variable for EGS is not only drilling time, but how many MWh can be extracted from the rock mass—and for how many years. If longer laterals, larger well diameters, optimized stimulation stages, higher flow rates, and reduced thermal short-circuiting double generating capacity per well, both CAPEX per kW and fixed cost per MWh fall even if drilling costs remain flat. Fervo Energy’s reduction in drilling time from 70 to 21 days, together with lower well costs, is significant; the next competitive frontier is the repeatability and long-term performance of high-output wells.
Closed-loop systems can reduce the risks associated with reservoir stimulation and fluid loss, but they tend to be constrained by conductive heat transfer. Raising net output therefore requires integrated optimization of contact area through extended laterals or multilateral wells, working fluids, insulation, pumping efficiency, and the surface power cycle. Standardized well designs and repeatable construction from a common pad could lower financing costs by improving both output predictability and construction learning.
For supercritical and superhot-rock geothermal, deep drilling and heat-resistant materials may increase absolute CAPEX. Even so, if high-enthalpy fluids enable large output from fewer wells, developers can reduce the number of wells per unit of plant capacity, along with land, piping, and surface facilities. The economic objective is not the cheapest well, but the lifetime generation value of each well. Any assessment must nevertheless account for well integrity, corrosion, scaling, and workover frequency under extreme-temperature conditions.
Comparing Generation Technologies: From LCOE to VALCOE and Total System Cost
LCOE indicates average plant-level cost but does not capture when generation occurs or how dependable it is. The IEA’s VALCOE framework adds energy, capacity, and flexibility value to LCOE to compare technologies from the grid’s perspective. Even when geothermal has a higher plant-level LCOE than solar PV or onshore wind, its high capacity factor, predictability, continuous operation, and dispatchability can narrow—and under some grid conditions reverse—the value gap.
Lazard’s LCOE+ framework similarly indicates that as variable renewables gain share, firming costs and the value of dependable capacity rise. The low raw LCOE of solar and wind is important, but 24/7 supply also requires overbuilding, short- and long-duration storage, transmission, balancing, and backup. A total-system-cost comparison must account for these additional costs and curtailment within a consistent system boundary.
International LCOE Comparisons: Align the Assumptions
Published estimates from international institutions differ in commissioning year, existing-versus-new-build status, discount rate, fuel and carbon prices, and capacity factor. Rankings should therefore never be compared without first aligning assumptions. For projects commissioned in 2025, IRENA reports global weighted-average LCOEs of USD 33/MWh for onshore wind, USD 44/MWh for solar PV, USD 62/MWh for hydropower, USD 78/MWh for offshore wind, USD 86/MWh for bioenergy, USD 89/MWh for geothermal, and USD 115/MWh for CSP. These figures compare renewable technologies based on actual projects; they are not a like-for-like comparison with nuclear or gas-fired generation.
The IEA/OECD NEA’s 2020 edition examined 243 plants in 24 countries, assuming commissioning in 2025 and using a real discount rate of 7% and a carbon price of USD 30/tCO₂ in its principal case. It compared nuclear, fossil-fuel, and renewable technologies under a common methodology. Solar and wind were found competitive with fossil generation in many regions; new nuclear remained competitive as dispatchable low-carbon power; and extending the life of existing nuclear plants was identified as the lowest-cost low-carbon option. These results nevertheless remain plant-boundary LCOE estimates, requiring VALCOE to reflect integration costs and capacity value.
| Generation source | LCOE (USD/MWh) | Basis | Interpretation |
|---|---|---|---|
| Onshore wind | 33 | IRENA, commissioned in 2025 | Lowest-cost tier among new renewables |
| Solar PV | 44 | IRENA, commissioned in 2025 | Low cost, but time-of-delivery value assessed separately |
| Hydropower | 62 | IRENA, commissioned in 2025 | Highly site- and project-specific |
| Offshore wind | 78 | IRENA, commissioned in 2025 | Sensitive to capital cost and grid connection |
| Bioenergy | 86 | IRENA, commissioned in 2025 | Highly dependent on fuel conditions |
| Conventional geothermal | 89 | IRENA, commissioned in 2025 | High-capacity-factor, dispatchable generation |
| CSP | 115 | IRENA, commissioned in 2025 | Thermal-storage value excluded from LCOE |
Next-Generation Geothermal LCOE: Published Estimates, Not Operating Track Records
LCOE estimates also exist for next-generation geothermal. Most, however, are forward-looking scenarios based on assumed technology learning, drilling cost, output per well, capacity factor, and WACC—not averages of commercial operating results. The IEA’s The Future of Geothermal Energy (2024) places first-of-a-kind next-generation geothermal at approximately USD 230/MWh and estimates that, with technology learning and lower capital costs, this could fall to around USD 50/MWh by 2035 and USD 30/MWh by 2050. Its 2035 comparison assumes an 80% capacity factor and 7% WACC.
The U.S. DOE’s 2024 Commercial Liftoff analysis estimates that nationwide average EGS LCOE could fall to USD 60–70/MWh by 2030, while the Enhanced Geothermal Shot sets an R&D target of USD 45/MWh by 2035. Current comparisons should therefore use IRENA’s USD 89/MWh for conventional geothermal, while treating next-generation geothermal separately as a future range—moving from roughly USD 230/MWh for FOAK projects toward USD 45–70/MWh in the 2030s. Because commercial experience with closed-loop and supercritical or superhot-rock geothermal is even more limited, these technologies require sensitivity analysis specifying depth, temperature, net output per well, make-up wells, thermal decline, and WACC rather than a single-point estimate.
| Estimating body | Scope | LCOE / target | Status |
|---|---|---|---|
| IEA (2024) | Next-generation geothermal | FOAK approx. USD 230/MWh; approx. USD 50/MWh in 2035; approx. USD 30/MWh in 2050 | Scenario estimate; 2035 comparison assumes 80% capacity factor and 7% WACC |
| U.S. DOE (2024) | Primarily EGS | USD 60–70/MWh in 2030 | Forward national-average estimate under commercial-liftoff assumptions |
| U.S. DOE Geothermal Shot | EGS | USD 45/MWh in 2035 | Policy and R&D target, not an observed result |
The implication is that next-generation geothermal should be valued not as a substitute for solar and wind, but as a complement that supports them. A portfolio that expands solar and wind while meeting residual demand with geothermal, hydropower, nuclear, storage, and demand response is more likely to reduce total cost and supply risk than dependence on any single technology. For a fuel-importing country such as Japan, geothermal also provides a long-term hedge against fuel, exchange-rate, and carbon-price exposure.
In practice, assessments should present in parallel: (1) plant-level LCOE; (2) VALCOE reflecting capacity, temporal, and flexibility value; (3) system costs including transmission, storage, and backup; (4) fuel- and carbon-price stress cases; and (5) land, water, and community impacts. The comparative advantage of next-generation geothermal does not reside in a single price point, but in the insurance value of dependable low-carbon power supplied over 20–30 years.
Market Design: Moving Beyond FIT/FIP Tariffs to Create a First-of-a-Kind Market
The U.S. lesson: Nevada approved a Clean Transition Tariff (CTT) involving Google, NV Energy, and Fervo Energy, creating a framework to procure 115 MW of round-the-clock EGS. Large customers bear the premium for the emerging technology, while the regulated utility provides long-term contracting and grid integration without shifting first-of-a-kind costs to ordinary ratepayers. This is more than a conventional corporate PPA: it is a regulated tariff model that integrates customer willingness to pay into resource planning.
Japan’s challenge: To build a comparable first-of-a-kind market, Japan must first distinguish what the existing FIT and FIP regimes can solve from what they cannot. For new geothermal projects in fiscal 2026, the procurement and reference prices are JPY 40/kWh below 1,000 kW and JPY 26/kWh at 30,000 kW or above, with a formula that reduces the price continuously between those thresholds as output increases. Eliminating the former tariff cliff at 15,000 kW is progress because it weakens the incentive to constrain plant size merely to remain within a preferred category.
A smoother price schedule does not automatically make projects profitable. Regulated prices are based on the cost and reasonable return of a standard efficiently executed project, and may not fully recover project-specific burdens such as lengthy development, exploration or unsuccessful wells, additional drilling, grid connection, community engagement, inflation, and shortfalls in output or steam supply. Moreover, if the tariff reduction associated with scale exceeds the added cost of more wells or greater depth, expected returns on medium- and large-scale projects may actually deteriorate. Viability should therefore be tested through project-specific cash-flow models incorporating generation, CAPEX, make-up wells, and WACC—not inferred from headline tariffs of JPY 40 or JPY 26/kWh.
This revenue challenge is still more acute for next-generation geothermal, whose uncertainties exceed those of conventional projects. The current FIT/FIP tariffs and formula chiefly reflect conventional geothermal cost structures and may not adequately cover FOAK technology-learning costs, deep drilling, specialized materials, and long-duration performance validation for EGS, closed-loop, and supercritical or superhot-rock systems. During early commercialization, a mechanism akin to cost-of-service recovery could therefore complement uniform tariffs, allowing reasonably incurred demonstration, construction, and operating costs plus a fair return to be recovered for a defined period. To prevent unchecked pass-through, it should include cost caps, milestones, independent technical review, disclosure, and performance-linked returns. This would distribute FOAK risk while allowing support to decline as learning accumulates in subsequent projects.
Not all FOAK costs need be borne by ordinary ratepayers. Here, the customer-participation model embodied in the U.S. CTT offers a useful precedent. A Japanese CTT could be structured as a tripartite agreement among a utility, a next-generation geothermal developer, and anchor customers such as data centers or semiconductor fabs. In exchange for paying incremental costs, large customers would receive hourly matched carbon-free attributes, capacity, and long-term supply. This would protect ordinary customers while mobilizing the creditworthiness and grid-operating capabilities of regulated utilities to commercialize FOAK projects.
FOAK support should be designed not as permanent protection, but as a transition toward competition. In Stage 1, public demonstration funding and conditional cost-of-service recovery would test technology and subsurface risk. In Stage 2, CTTs, long-term PPAs, and debt guarantees would shift more financing and cost responsibility to private capital and participating customers. Once repeatable performance is established, Stage 3 would transition to competitive auctions, FIP support, and capacity markets. Support should be reduced by technology type, geological setting, and replication record—not by treating geothermal as a single homogeneous category. This sequence avoids the false choice between declaring a technology mature and therefore undeserving of support, and maintaining permanently high FITs.
Conclusion: Build Next-Generation Geothermal Around System Value, Not a Stand-Alone Energy Price
The economics of next-generation geothermal are not determined by absolute CAPEX alone. Greater net output per well, higher capacity factors, longer operating lives, and effective management of thermal decline and make-up wells allow fixed costs to be recovered over more MWh. Viewed through VALCOE, dependable capacity, time-matched low-carbon generation, fuel-price hedging, and avoided transmission and storage investment add further value.
Japan should therefore neither force next-generation geothermal into existing tariff categories nor shelter it indefinitely behind high prices. FOAK projects should combine public funding, conditional cost recovery, and anchor-customer willingness to pay to absorb uncertainty, then transition to market-based procurement as operating evidence accumulates. Designing validation, risk reduction, and competition as a continuous policy sequence offers the most credible path for turning EGS, closed-loop, and supercritical or superhot-rock geothermal into sustainable commercial generation.
References
- International Energy Agency, The Future of Geothermal Energy, 2024.
- IEA, “Techno-economic inputs: Value-adjusted LCOE,” 2025.
- International Energy Agency and OECD Nuclear Energy Agency, Projected Costs of Generating Electricity 2020, 2020.
- U.S. Department of Energy, Pathways to Commercial Liftoff: Next-Generation Geothermal Power, 2024.
- National Laboratory of the Rockies, 2025 U.S. Geothermal Market Report, 2026.
- Lazard, Levelized Cost of Energy+ Version 18.0, 2025.
- Fervo Energy, “Drilling Results Show Rapid Advancement of Geothermal Performance,” 2024.
- Google, “Our first-of-its-kind partnership for clean energy has been approved in Nevada,” 2025.
- NEDO, Green Innovation Fund, “Development of Next-Generation Geothermal Technologies,” 2026.
- Agency for Natural Resources and Energy, “Interim Report of the Public–Private Council for Promoting Next-Generation Geothermal,” 2025.
- Ministry of Economy, Trade and Industry, “FIT/FIP Procurement Prices and Related Terms for Fiscal 2026 and Beyond,” 2026.
- Clean Air Task Force, Gaps, Challenges, and Pathways Forward for Superhot Rock Geothermal, 2025.
- International Renewable Energy Agency, Renewable Power Generation Costs in 2025, 2026.


Free Membership Registration
What You Can Do After Registering
All articles are available to read free of charge. Free membership registration is required to download reports.
- You can download all reports that we make available free of charge in the future.
- You can opt in to receive our newsletter (the launch date and frequency will be determined at a later date).

This is a Japanese-English bilingual media outlet specializing in geothermal energy, operated by GeoVanguard Energy Inc. Information from Japan tends to stay within Japanese, while overseas information does not reach Japan. Our purpose is to bridge that gap.